
Details
Global Warming Early Warning Signs Map
|
|
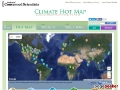
Global temperature in 1998 was the hottest in the historical record, and the temperature increase over the 20th century is likely to be the highest of the past millennium. Global average temperatures have warmed about one degree Fahrenheit (0.6?C) since 1900. The ten warmest years on record have occurred since 1987, seven of them since 1994. This map illustrates the local consequences of global warming. Dr. Sharon Locke of the University of Southern Maine and Dr. Susanne Moser of the Union of Concerned Scientists researched, categorized, and described the events featured on this world map and completed a map update in January 2003 based on the latest scientific findings. This updated map builds on work originally undertaken by the Sierra Club and extended by Dr. Janine Bloomfield and Molly Smith of Environmental Defense and Dr. Sharon Locke for the first edition, published in 1999. The Union of Concerned Scientists (UCS) has developed background materials on the map for scientists and map curriculum materials for high school teachers. |
| 359 views. Averaging 0 views per day. |
Please login or register if you wish to leave a comment.
Is this your listing? Update and claim it!
Submit
New Links
Most Popular
Quick Search
Statistics
3,012 listings in 21 categories, with 2,251,362 clicks. Directory last updated Sep 12, 2023.
Welcome Amara Fatima, the newest member.
Comments on Global Warming Early Warning Signs Map